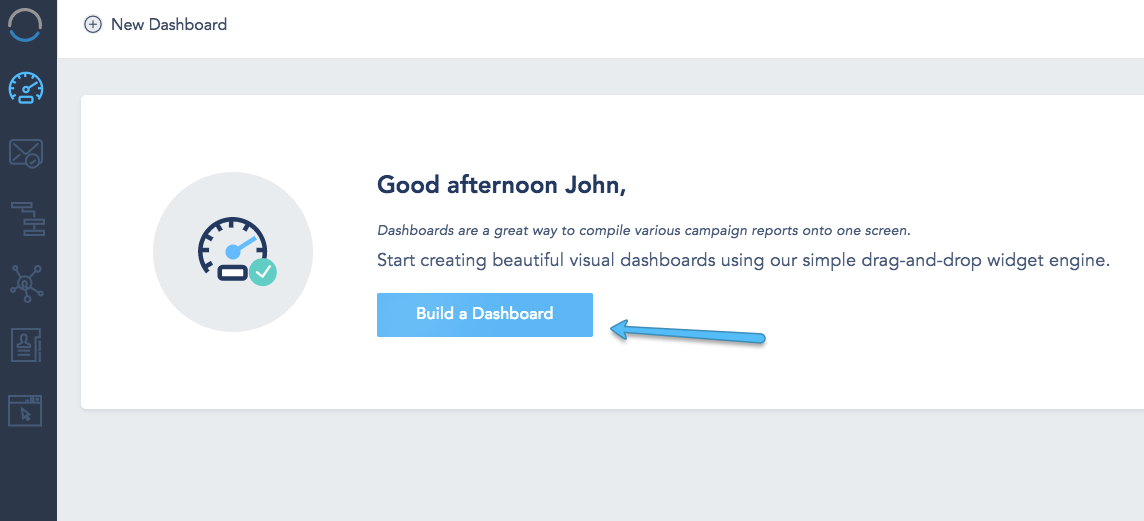
To create your first dashboard:
- Click on Build a Dashboard.

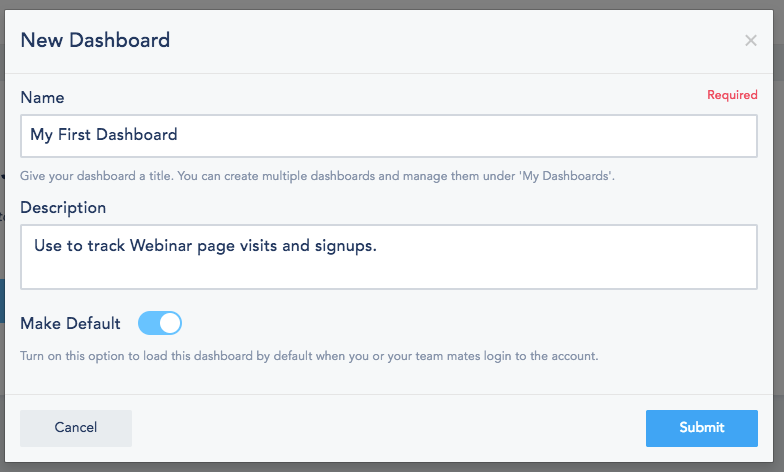
- Give your Dashboard a name and description then choose if you wish to make it the default dashboard to load once you login to your account.

- Drag any report widget from the list and drop it in the area underneath. Each widget will have its own custom settings that you can configure once you drop the report into the dashboard. Use the date picker to specify the range for which to show the report. Presets like today and last week will auto update each time your login.


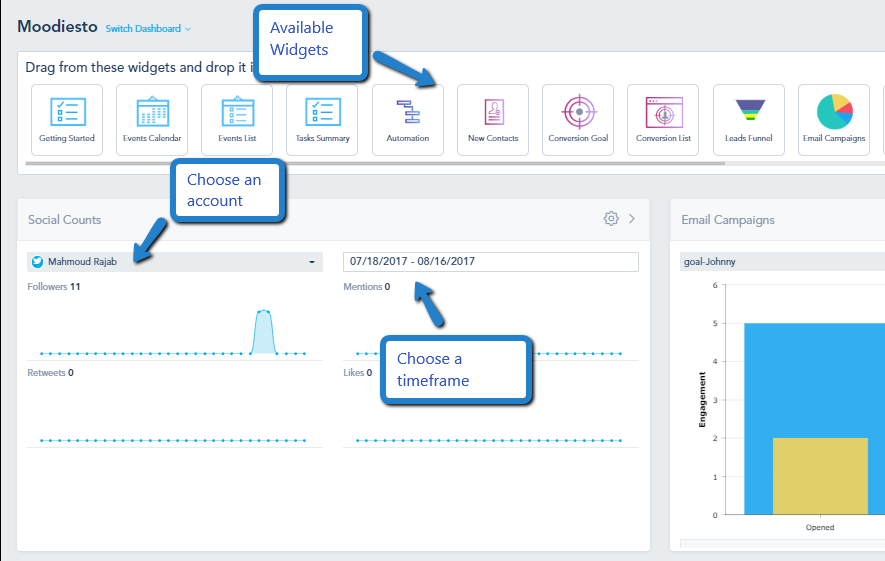
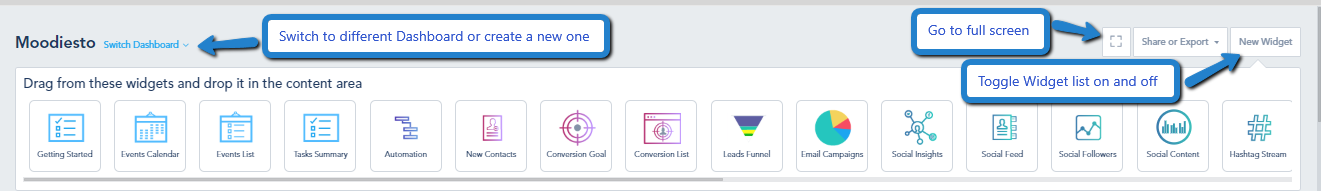
Below is a list of the widgets available on the platform:
- Events Calendar: List of all scheduled or posted events, email marketing, and social media. You can configure it to show by profile.
- Events List: Just like the calendar but in an event format.
- Tasks Summary: A list of tasks with the assignee, task board, stage, due date, within a stage, teammate and timeframe of your choice.
- Automation: You can filter this by workflow to view performance results.
- New Contacts: List of the most recent contacts who joined your list(s). You can choose one or more lists.
- List Summary: A summary of your lists with the number Active, Unsubscribed, and Bounced contacts.
- List History: A graph that shows you how many contacts joined the list in reference to the time range that you specify.
- List Growth: A graph that shows you the variation of contacts joining the list in reference to the time range that you specify.
- Conversion Goal: Gives you data on a specific conversion goal created within the platform.
- Conversion List: Table list of all your Goals along with their summary.
- Leads Funnel: Your lead scoring funnel, which needs to be installed on your account and active with all stages.
- Email Campaigns: Performance of your email campaign, Email open and CTR.
- Social Insights: Quick snapshot data on a specific social media profile, for a given time frame.
- Social Feed: One feed from one of your social media channels, ex: Twitter Messages.
- Social Followers: Side by side followers line chart from multiple social media profiles, ex: Facebook vs Twitter vs Instagram.
- Social Content: Content from a specific social account during a specific date.
- Hashtag stream: Choose a hashtag you added from your social media suite.
- Ad Accounts: View high level metrics view of your Google Ads & Facebook Ads accounts
- Google Analytics: Pulls a report from your Google Analytics account, which you need to connect to your dashboard. 8 Widgets currently supported.
- Landing Page: Performance report of a specific landing page, visits vs conversion.
- Site Popup: Performance of one of your Webhooks, impressions vs conversion. ex: homepage popup performance.
- Website Visitors: Breakdown of your site visitors, Anonymous vs Contacts.
- Top Visited Pages: List of the pages that are visited the most.
- Top Devices: Visit breakdown per device.
- Referral Sources: List of top referrals tracked by the platform.
- Social Sources: List of top social media referral channels tracked by the platform.
- Paid Referral: List of top paid ad channels tracked by the platform. Must use UTMs in your marketing campaigns for this to work.
- Browser Push: Analytics from a specific Browser Push.
- Browser Push Templates: Analytics for a Browser Push Template.
- Partnership MRR: Table view of your Partnership MRR.
- Store Sales: Choose a store integrated into your account and monitor its sales
- Top Buyers: The top buyers from your store.
- New Orders: New orders in your stores.
- Sales by Country: Sales divided geographically.
- Retention: A graph showing new customers and retained customers
- Checkout Funnel: A funnel of the steps that the client followed before reaching checkout.
- Product Search: The products searched in your store.
- Revenue by Campaign: See all metrics revenue broken down by campaign.
- Revenue by Automation: See all metrics revenue broken down by automations.
- Revenue by Channel: See all metrics revenue broken down by channels (email campaigns, automated messages, SMS, browser push.
Was this article helpful?
That’s Great!
Thank you for your feedback
Sorry! We couldn't be helpful
Thank you for your feedback
Feedback sent
We appreciate your effort and will try to fix the article